The XDA piece on turning a Windows PC into homelab mission control was a familiar feeling: most of us run our self-hosted services on Linux or in containers, but the daily driver is still Windows. The trick is bridging the two — making the Windows desktop the central console for monitoring, managing, and SSHing into the home server farm without context-switching for every small task.
We tested eight free apps that handle the bridge. They cover the four pieces of a working homelab control center: container management, server monitoring, dashboards, and remote terminal access. Every pick is free, most are open source, and the entire kit runs from a single Windows desktop without paying for a single SaaS subscription.
What to look for in homelab control apps
A good homelab control kit covers four areas. The apps that work best:
- Run as a service on the Linux side and expose a clean web UI to your Windows browser. This is the standard pattern and the most maintainable one.
- Survive container restarts and host reboots. If you have to manually re-add hosts after every Docker update, the tool is wrong.
- Use API-first architecture. Tools that expose a clean API let you script the boring parts and integrate with your monitoring stack.
- Stay free as you grow. Several of the polished alternatives in the homelab space have raised prices as they courted enterprise customers; we filtered those out.
- Work with the homelab stack you already have. Docker, Proxmox, Cockpit-managed bare metal, Kubernetes — the right tools support multiple backends rather than locking you in.
Quick comparison
| App | Best for | Free plan | Open source | Self-hosted |
|---|---|---|---|---|
| Portainer | Container management across multiple hosts | Yes, Community Edition | Yes (zlib) | Yes |
| Cockpit | Web-based admin for Linux servers | Yes, fully | Yes (LGPL) | Yes |
| Homepage | Dashboard linking everything together | Yes, fully | Yes (GPL-3.0) | Yes |
| Beszel | Lightweight server resource monitoring | Yes, fully | Yes (MIT) | Yes |
| Tabby | Modern Windows-side terminal for SSH | Yes, fully | Yes (MIT) | Client-only |
| WinSCP | File transfer between Windows and Linux | Yes, fully | Yes (GPL-3.0) | Client-only |
| Glances | Top-style cross-platform system monitor | Yes, fully | Yes (LGPL-3.0) | Yes |
| Uptime Kuma | Service uptime monitoring with notifications | Yes, fully | Yes (MIT) | Yes |
The 8 best homelab control apps for a Windows desktop
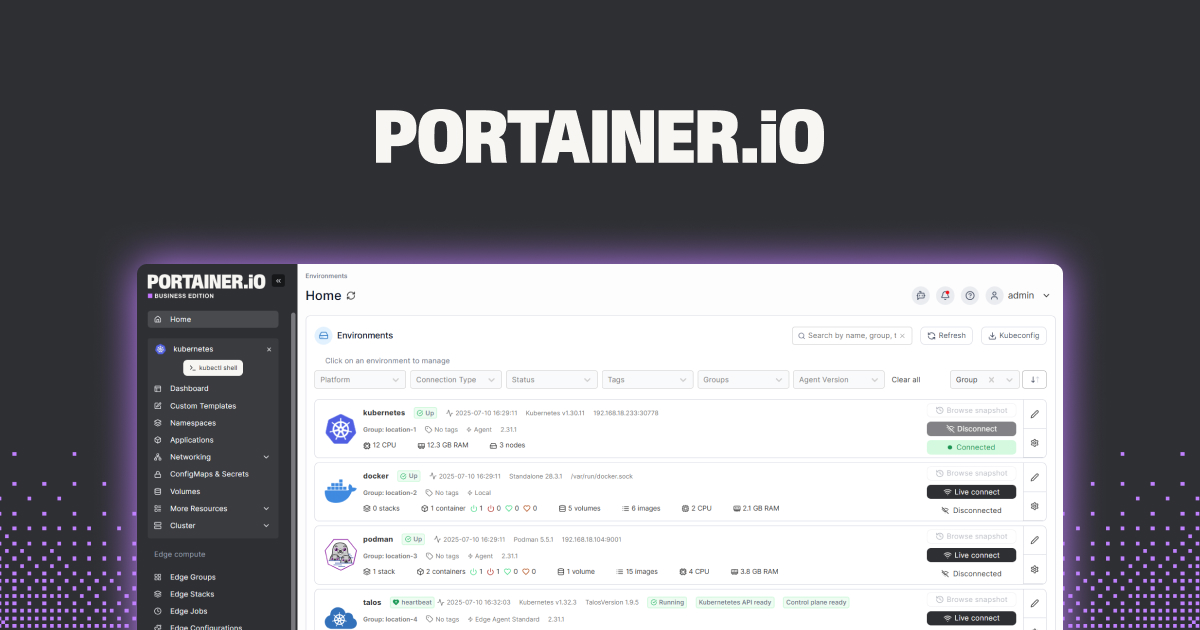
1. Portainer — best container management UI
Portainer is the de facto standard web UI for Docker, Docker Swarm, and Kubernetes management. The Community Edition runs as a Docker container on your homelab host, exposes a clean web interface from the Windows browser, and connects to additional hosts through a lightweight agent. You can start, stop, restart, and update containers, manage volumes and networks, and read live logs without ever touching a terminal.
The 2025 Portainer 2.20 release tightened the Kubernetes story and added an improved Edge Compute interface for managing remote sites — useful if your homelab has spread to a second physical location.
Where it falls short: The Business Edition adds RBAC, multi-tenancy, and registry management behind a paid licence. For a single-operator home setup, the Community Edition is sufficient, but team setups eventually push toward the paid tier.
Pricing:
- Free: Community Edition with unlimited environments and core management
- Paid: Business Edition starts at five-node tiers around $10/mo, with enterprise pricing for larger setups
Platforms: Runs on Linux (Docker / Docker Compose / Kubernetes) — accessed from any browser on Windows, macOS, or Linux.
Download: portainer.io · GitHub releases
Bottom line: Install this first. It’s the single highest-value piece of any homelab control kit.
2. Cockpit — best web admin for Linux bare metal
Cockpit by Red Hat is the web-based admin tool for Linux systems where Portainer’s container focus is the wrong abstraction. You manage user accounts, service systemd units, network interfaces, storage, and software updates through the browser. It’s the closest the Linux world comes to a Windows-style “Server Manager” — one tab to look at logs, another to restart a service, a third to add a user.
Cockpit’s modular architecture (machines module for VMs, podman module for containers, network manager module for advanced network config) means you can extend exactly the parts of system administration you want exposed to the browser.
Where it falls short: Hostname-based, multi-machine views require manual addition of each host. Less polished than purpose-built dashboards. Not a Docker-specific tool — for container work, Portainer is better.
Pricing:
- Free, open source under LGPL
Platforms: Runs on Linux (RHEL, Fedora, Debian, Ubuntu, Arch) — accessed from any browser.
Download: cockpit-project.org
Bottom line: Install Cockpit on every Linux box you run. It’s the closest thing to a Windows MMC equivalent.
3. Homepage — best central dashboard
Homepage by gethomepage is the open-source dashboard that pulls together every service your homelab runs into a single page. Each tile shows live status (a small “up” indicator, the latest sync time, the active stream count for a media server). You configure it through YAML files in a Docker volume, and any service with a public-API can pull live data into its tile.
The 2025 releases added widget integrations for Frigate (CCTV), Tdarr (transcoding), and Beszel (system monitoring), which made the dashboard genuinely useful at-a-glance rather than just a glorified link list.
Where it falls short: Configuration is YAML-first, which is a learning curve for non-DevOps users. No drag-and-drop UI editor. Some integrations require widget-specific permissions on the linked service.
Pricing:
- Free, open source under GPL-3.0
Platforms: Runs on Linux (Docker) — accessed from any browser.
Download: gethomepage.dev · GitHub releases
Bottom line: Install this once you have 4+ services running. The live status widgets are what makes it useful, not the link bookmarks.
4. Beszel — best lightweight server monitoring
Beszel is the rising-star alternative to Grafana + Prometheus for users who want server resource monitoring without managing a time-series database. The single binary runs on each host, reports back to a central dashboard, and gives you CPU, memory, disk, network, and Docker container metrics — exactly what most home users need, with none of the operational overhead of the full Prometheus stack.
The 2025 1.0 release stabilised the API and added system-temperature widgets, which were the missing feature for users running NUC-style systems with thermal-throttling concerns.
Where it falls short: Less mature than Prometheus + Grafana for retention and alert routing. Not the tool for users who need deep historical metric storage or complex alerting rules.
Pricing:
- Free, open source under MIT licence
Platforms: Runs on Linux, macOS, Windows — agents on each monitored host, hub on any of them.
Download: beszel.dev · GitHub releases
Bottom line: Pick Beszel as your first monitoring tool. Migrate to Prometheus only when you need its specific advanced features.
5. Tabby — best modern Windows-side terminal
Tabby is the Windows terminal experience that PuTTY users keep wishing they had: tabbed, themable, configurable, and built around a modern UI. SSH sessions, serial ports, and local PowerShell or WSL shells all live in the same window, with saved connections that auto-resume, key management built in, and integration with the Microsoft Store distribution.
For homelab use, Tabby’s saved-connection list is the killer feature — every Linux host you manage gets a single tab with the correct user, key, and starting directory, and Ctrl+Tab cycles between them. The split-pane view lets you watch logs on one host while restarting a service on another.
Where it falls short: Heavier than Windows Terminal — a few hundred MB of memory per running instance. Some niche terminal features (advanced SSH multiplexing, jump-host chains) require manual config-file edits.
Pricing:
- Free, open source under MIT licence
Platforms: Windows, macOS, Linux.
Download: tabby.sh · GitHub releases
Bottom line: Install Tabby. The saved-connection list and tabbed multi-host views replace 90% of what makes PuTTY painful.
6. WinSCP — best Windows-to-Linux file transfer
WinSCP is the unglamorous, deeply reliable tool for moving files between your Windows desktop and the Linux side of the homelab. SFTP, SCP, and FTPS sessions appear as a two-pane file manager (your Windows file system on the left, the remote host on the right). Drag a file across; it just transfers. The integration with PuTTY for terminal sessions on the same host is older but still works.
For homelab use, WinSCP’s site-manager (with saved keys, hostnames, and starting directories per host) is what makes it stick. You’ll find yourself opening WinSCP for “I just need to move this one config file” tasks dozens of times a week.
Where it falls short: UI feels dated compared to Tabby. Synchronisation features exist but are not the focus — for serious sync, Syncthing is a separate, better tool.
Pricing:
- Free, open source under GPL-3.0
Platforms: Windows.
Download: winscp.net · Microsoft Store
Bottom line: Install WinSCP alongside Tabby. The two together cover terminal and file transfer for any Linux host.
7. Glances — best cross-platform system monitor
Glances is the top-style system monitor that runs on Windows, Linux, and macOS with the same UI. The terminal-mode view fits comfortably in a Tabby pane and shows CPU, memory, disk I/O, network, and process information at-a-glance. The web mode (started with glances -w) exposes the same view as a browser-facing dashboard with optional history.
For homelab use, Glances earns its spot by being the one tool that runs the same on every host. You SSH into a Linux box, run glances, and you get the same view you get on your Windows desktop. Consistency across hosts removes a small but real cognitive load.
Where it falls short: Less polished than Beszel for centralised multi-host monitoring. Some plugins (Docker, sensors) require additional setup.
Pricing:
- Free, open source under LGPL-3.0
Platforms: Windows, macOS, Linux, FreeBSD.
Download: nicolargo.github.io/glances · GitHub releases
Bottom line: Pick Glances for single-host monitoring and quick diagnostics. Pair with Beszel for the centralised view.
8. Uptime Kuma — best uptime monitoring with notifications
Uptime Kuma is the open-source self-hosted Uptime Robot clone. You point it at each service in your homelab (a Plex instance, a Nextcloud, a self-hosted Vaultwarden), set the check frequency, and configure notification channels (Telegram, Discord, ntfy, email). When a service goes down, you get pinged on every channel you configured.
For homelab use, Uptime Kuma is the canary that wakes you up at 3am when your Pi-hole has stopped resolving DNS. The setup takes ten minutes, the maintenance is essentially zero, and the peace of mind is substantial.
Where it falls short: No log aggregation — Uptime Kuma tells you a service is down, not why. Some users find the notification fan-out heavy if you wire it to every channel.
Pricing:
- Free, open source under MIT licence
Platforms: Runs on Linux (Docker) or as a Node.js process anywhere — accessed from any browser.
Download: uptime.kuma.pet · GitHub releases
Bottom line: Install Uptime Kuma early. The first time it wakes you up before a user notices, it’s paid for itself.
How to pick the right combination
Start with the four-tool core. Portainer for containers, Cockpit for Linux admin, Tabby for terminal access, and Homepage for the dashboard. Those four solve the daily grind on day one.
Add Beszel for monitoring once you have 3+ hosts. The centralised view becomes useful around that scale.
Add Uptime Kuma the moment a service drops without warning. It’s the cheapest investment for the highest peace-of-mind return.
Use Glances for quick diagnostics when SSH’d into a single host. It’s not a replacement for Beszel — it’s the equivalent of top with a friendlier UI.
WinSCP is your tenth-most-used app the moment you start moving config files between machines. Install it preemptively.
Frequently asked questions
Do I need all eight apps to run a homelab?
No. The four-tool core (Portainer, Cockpit, Tabby, Homepage) covers daily homelab operations for most setups. Beszel, Uptime Kuma, and Glances become useful once you have multiple hosts or critical services. WinSCP is the only one we’d call a near-universal install.
Can I run all of these on a single Linux server?
Yes. Portainer, Cockpit, Homepage, Beszel, Uptime Kuma, and Glances are all Docker-friendly and run alongside each other on a single host without notable resource overhead. A 4-core, 8 GB Linux box can host all of them with room to spare.
What is the difference between Portainer and Cockpit?
Portainer is container-first — Docker, Docker Compose, Kubernetes. Cockpit is server-first — users, services, network, storage, software updates. Most homelab setups run both, on the same host, because they cover different abstractions.
Is there a free Uptime Robot alternative?
Uptime Kuma is the open-source self-hosted Uptime Robot equivalent. It supports the same protocol checks (HTTP, ping, TCP, DNS, JSON-API checks), notification channels, and status-page generation as Uptime Robot’s free tier, with no rate limits or check-frequency restrictions.
What is Beszel and why is it better than Grafana?
Beszel is a lightweight server monitoring tool — single binary, minimal config, web UI out of the box. It is not better than Grafana for advanced use cases. It is better for users who want CPU, memory, disk, and Docker metrics without standing up Prometheus, Grafana, and exporters. The tradeoff is depth: Grafana wins for retention, alerting, and dashboarding flexibility.
Can I use these apps without a homelab?
The terminal (Tabby) and file transfer (WinSCP) tools are useful even for a single Linux VM. Portainer is useful with a single Docker host. The rest become valuable only once you’re managing multiple services or hosts.